The reports are divided into several tables/graphs. As in other reports, you can set the period for displaying data by clicking on the calendar icon


FBL (Feedback Loop) complaints
FBL reports offer information about recipients who have marked one of your messages as SPAM. If this happens, these recipients are unsubscribed immediately and you will find the note “Spam report” in the list of unsubscribed recipients.
You should always try to eliminate cases where your recipient marks your message as spam. You can achieve this, for example, by informing the recipient right at the beginning of the communication about what messages and how often you will send them. Likewise, you should always try to make the unsubscribe link clearly visible (recipients most often look for it in the footer of the message), so that the recipient chooses to unsubscribe if she/he no longer wants to receive your message.
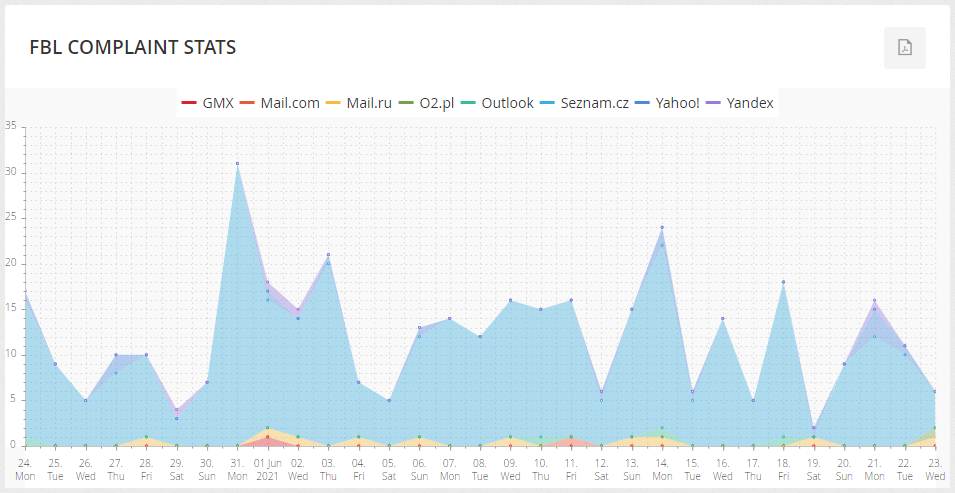
Complaint stats
Cumulative graph of the sum of FBL complaints from more than 20 email providers. You can change the displayed data range by scrolling the mouse in the graph area.
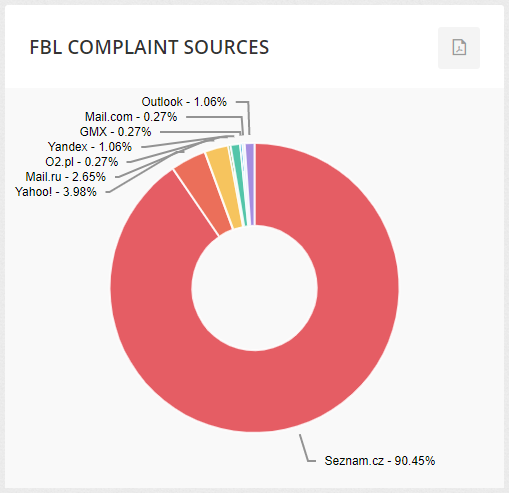
Complaint sources
The graph shows the percentage distribution of FBL complaints by provider. Hovering the mouse over a part of the graph will display information with the number of complaints for the given provider.
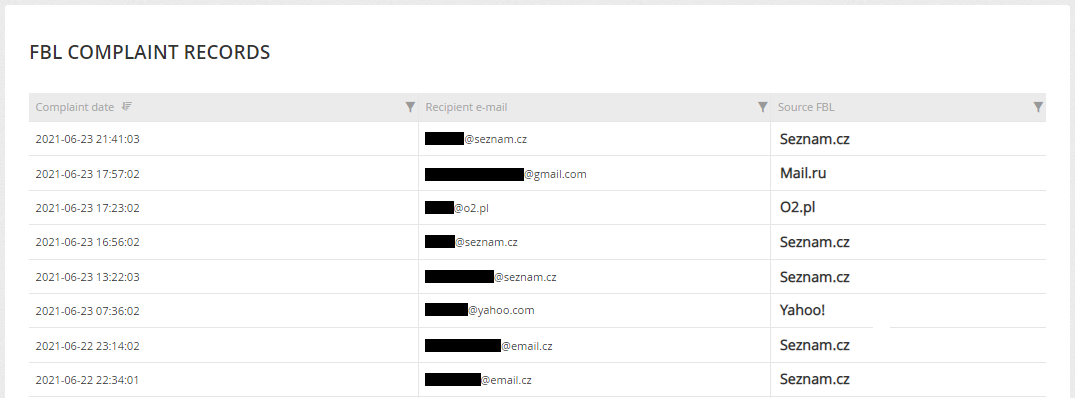
Complaint records
A detailed overview of recipients who marked some of your messages as spam during the given period. You can further filter in the list by clicking on
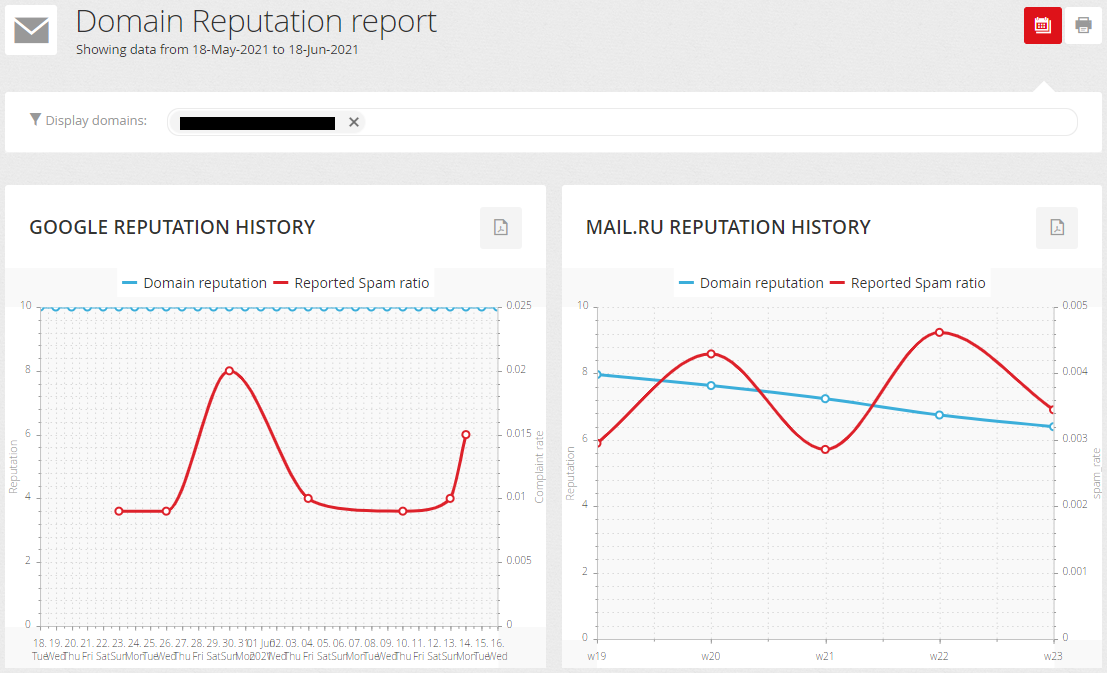
Domain Reputation report
The report shows the history of the domain reputation (HIGH / MEDIUM / LOW) and the reported spam ratio (in %) for Google and Mail.ru. The reputation of your domain has a major impact on delivery, so it is very important to constantly build and strengthen your reputation.
The report also includes an overview of whether the domain(s) do not appear on any of the monitored blacklists.

To set up and display this report please contact us.
DMARC reports
DMARC is a technology for protecting domain against abuse and allows domain owners to specify security rules for email messages from their domain. DMARC reporting then makes it possible to detect gaps in email authentication and very effectively monitor the processing of messages by receiving servers.
You can find complete DMARC statistics in our interface, so there is no need to purchase separate tools for processing DMARC reports. Instead, integrating all of these tools in one interface will give you an overview of what can affect your deliverability.
The basic prerequisite for DMARC reports to be displayed is the deployment of a DMARC record in the DNS of your domain. If subdomains exist, it is always the optimal solution to deploy the DMARC record on the main domain, because the rules from the main domain are then applied to the subdomains as well.
If you do not have a DMARC record on your domain, deploy it as follows: _dmarc IN CNAME yourdomain-xy.dmarc.mailkit.com. (The record often needs to be inserted including a dot at the end). After deploying this record, we can then help you effectively with its further adjustments and tightening of the rules.
If you already have DMARC, you can add our address dmarc-rua@mailkit.com to the "rua" part of the record.
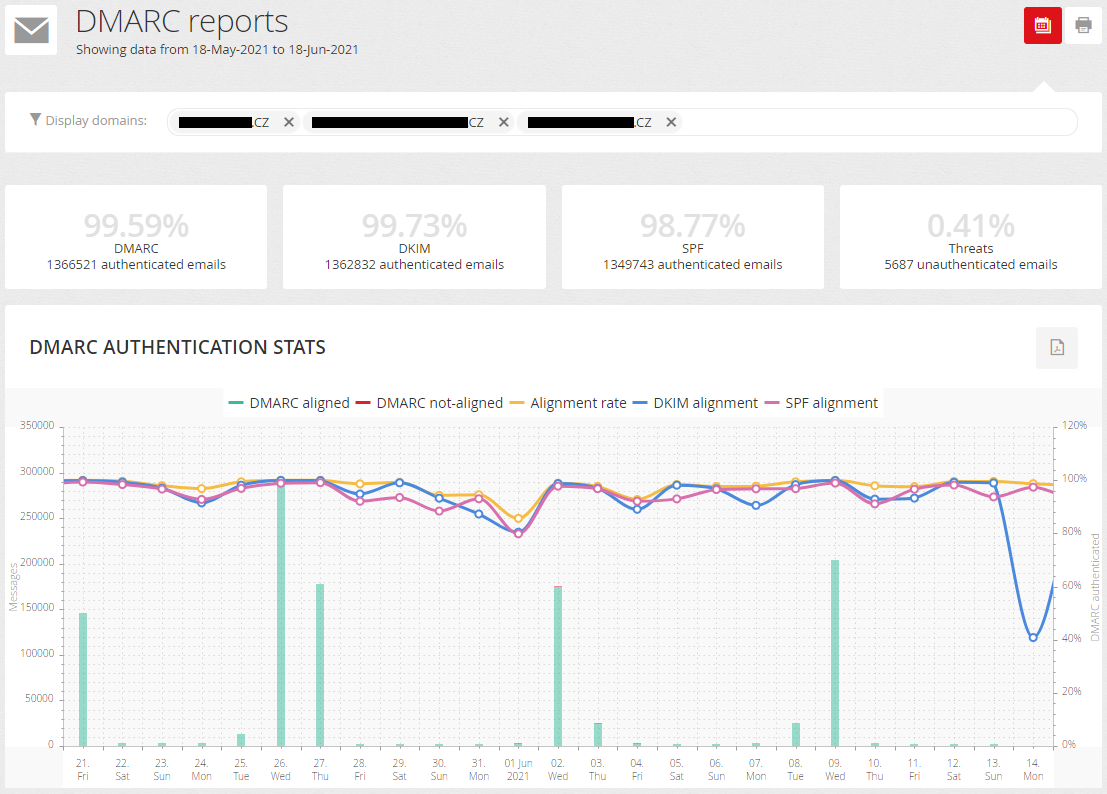
In the report you can set for which domains it will be displayed. The report can be displayed only for domains that you use for your sending addresses and have all the necessary records set in DNS (SPF, DKIM, DMARC).
The introductory table and graph show the ratio/number of DMARC/DKIM/SPF authenticated emails and the ratio/number of unauthenticated emails that may be a potential threat.
DMARC policies

Here you will find detailed information about your DMARC record on your domain or domains. You will also find a recommended DMARC record here in case you use, for example, our general DMARC record (_dmarc IN CNAME dmarc.mailkit.eu.). If you are still using it, please replace it with the recommended DMARC record.
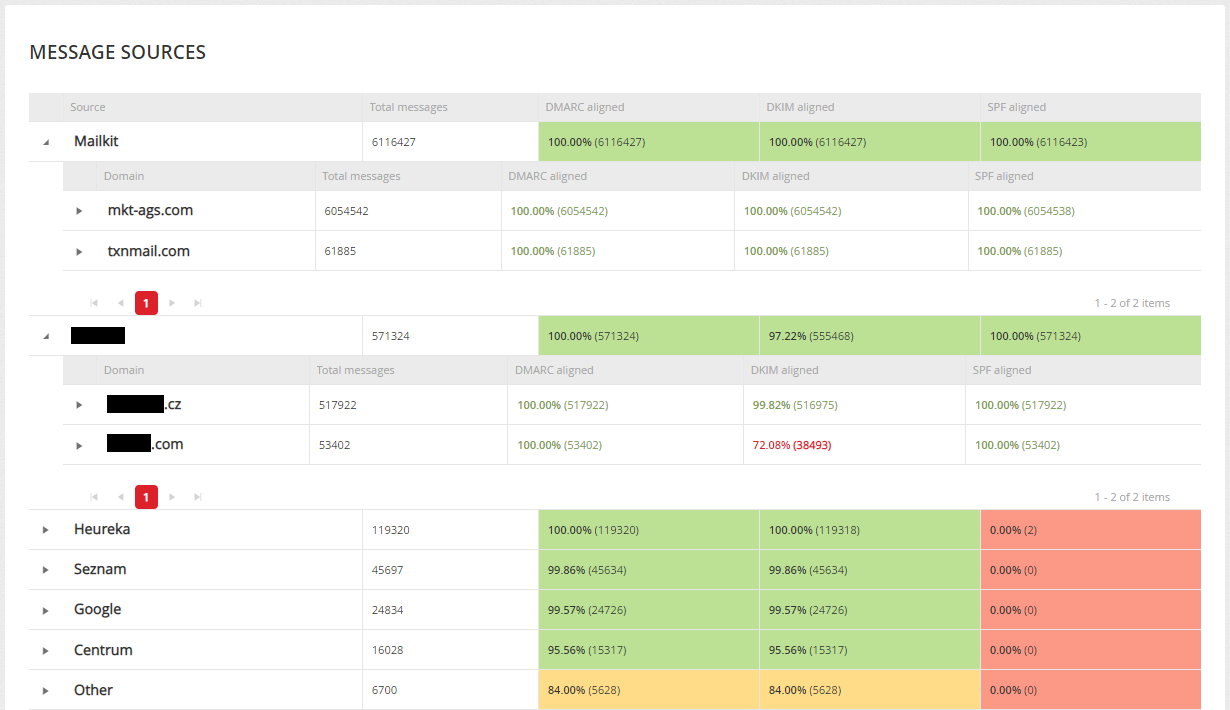
Message sources
The last part of the DMARC report is detailed information about the sources of your messages. This report will help you analyze all message flows on your domain. This allows you to identify which sources of your messages are not properly authenticated, even if they should (eg. messages from your billing system), or to identify unauthenticated sources that are a potential threat (eg. phishing attacks).
It is on the basis of this report and its careful analysis that you can start tightening up the rules of the DMARC policy. We will be happy to guide you through the entire analysis process and the subsequent tightening of the DMARC policy, do not hesitate to contact us.
List hygiene history
This graph displays information about the number of unwanted recipients and thus reflects the quality of the data transmitted to the Mailkit - eg. by import, data sources or login forms. A unique set of information obtained, among other things, by operating one's own anti-spam network is used to assess quality. It is important to mention that this is data about addresses that are passed to us, but are often filtered on the input, ie. these recipients do not have to be added to any list of recipients, their import is not completed.
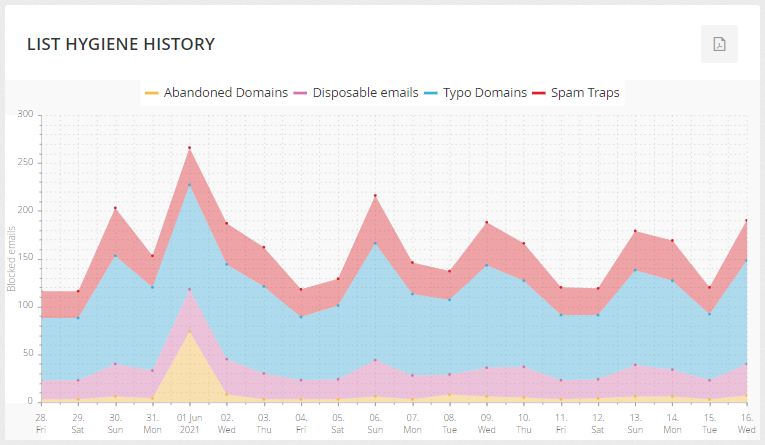
Thanks to the report, you can see the number of identified:
- Spam Traps
- Typo Domains (eg. @gmai.com, @gmail.con, and so on)
- Abandoned Domains
- Disposable Emails
Based on your knowledge of this data, you can then optimize address obtaining processes, either by improving address validation in forms or by cleaning up your database.
Deliverability History
The report displays detailed statistics on message delivery, filtering, sorting into folders (delivered/promo/spam) obtained directly from data from mailbox providers. It is not necessary to rely on test boxes, checking data in various statistics, but you have everything directly from the source and in one place in comparable values.
In the introductory overview of the Deliverability History report, a graph of data is displayed together for Seznam.cz and Mail.ru. After clicking on the “Details” button in the upper right corner of the graph, separate graphs for individual providers are displayed.
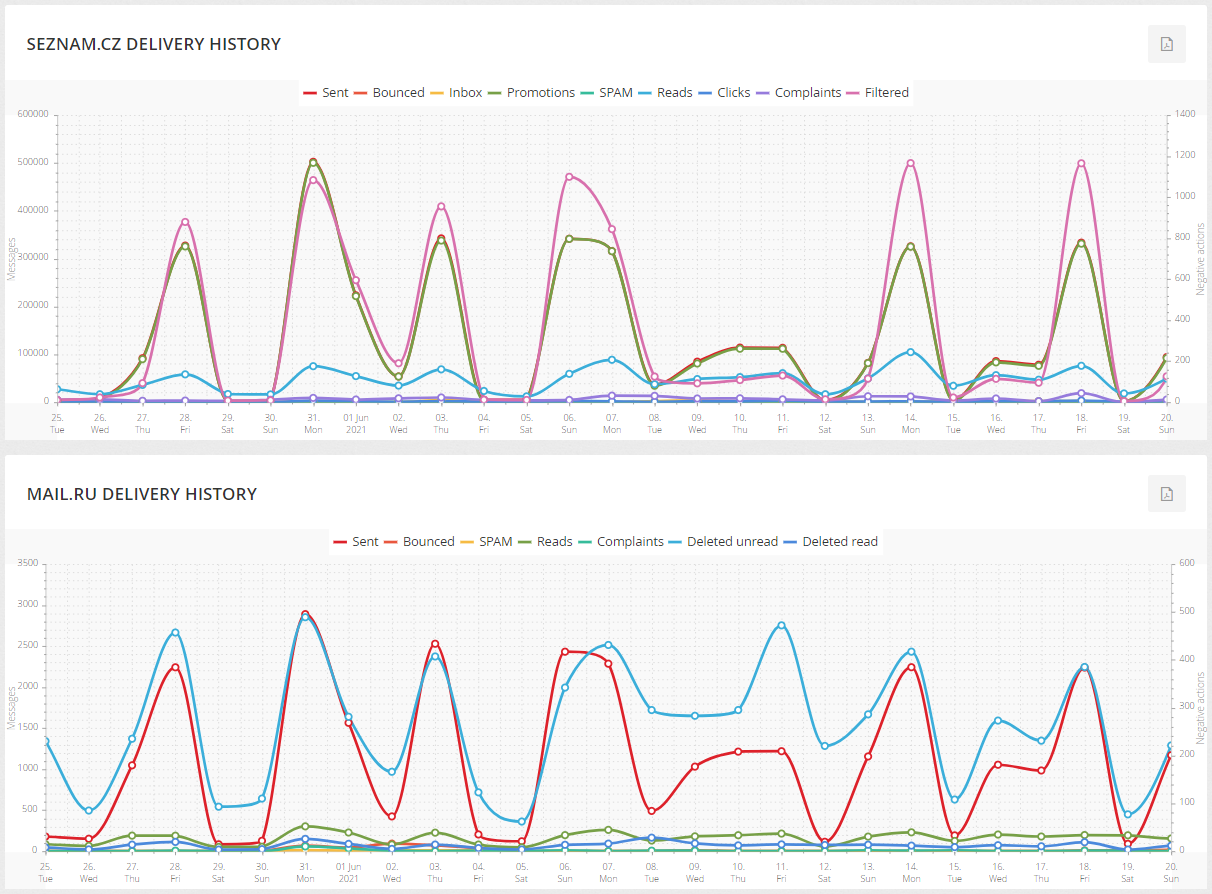
Sent – number of messages that have been sent
Inbox – number of messages delivered to the Inbox
Promotions – number of messages delivered to the Promo/Bulk folder
SPAM – number of messages that were delivered to the SPAM folder
Reads – indicates how many recipients have read the message
Clicks – Indicates the number of clicks from the messages
Complaints – number of recipients who marked the message as SPAM
Filtered – number of messages that have been placed in the folder in the mailbox based on the filter set by the recipient
Bounced – number of messages that could not be delivered to mailboxes
Deleted unread – number of messages that were delivered to the mailbox, but the recipient deleted them without opening them
Deleted read – number of messages that recipients read and then deleted immediately
By clicking on the 


